


Introduction
This report provides a comprehensive overview of accident and injury statistics in California for the 2026 edition. It synthesizes data from various official sources, including the California Office of Traffic Safety (OTS) and the California Department of Transportation (Caltrans), as well as reputable research and legal analyses. The report covers key areas including car accident data by county, pedestrian and bicycle injury trends, DUI accident statistics, insurance claim payout averages, wrongful death numbers, and hospitalization costs by injury type. Additionally, year-over-year comparison charts are provided to illustrate significant trends and patterns.
Car Accident Data by County
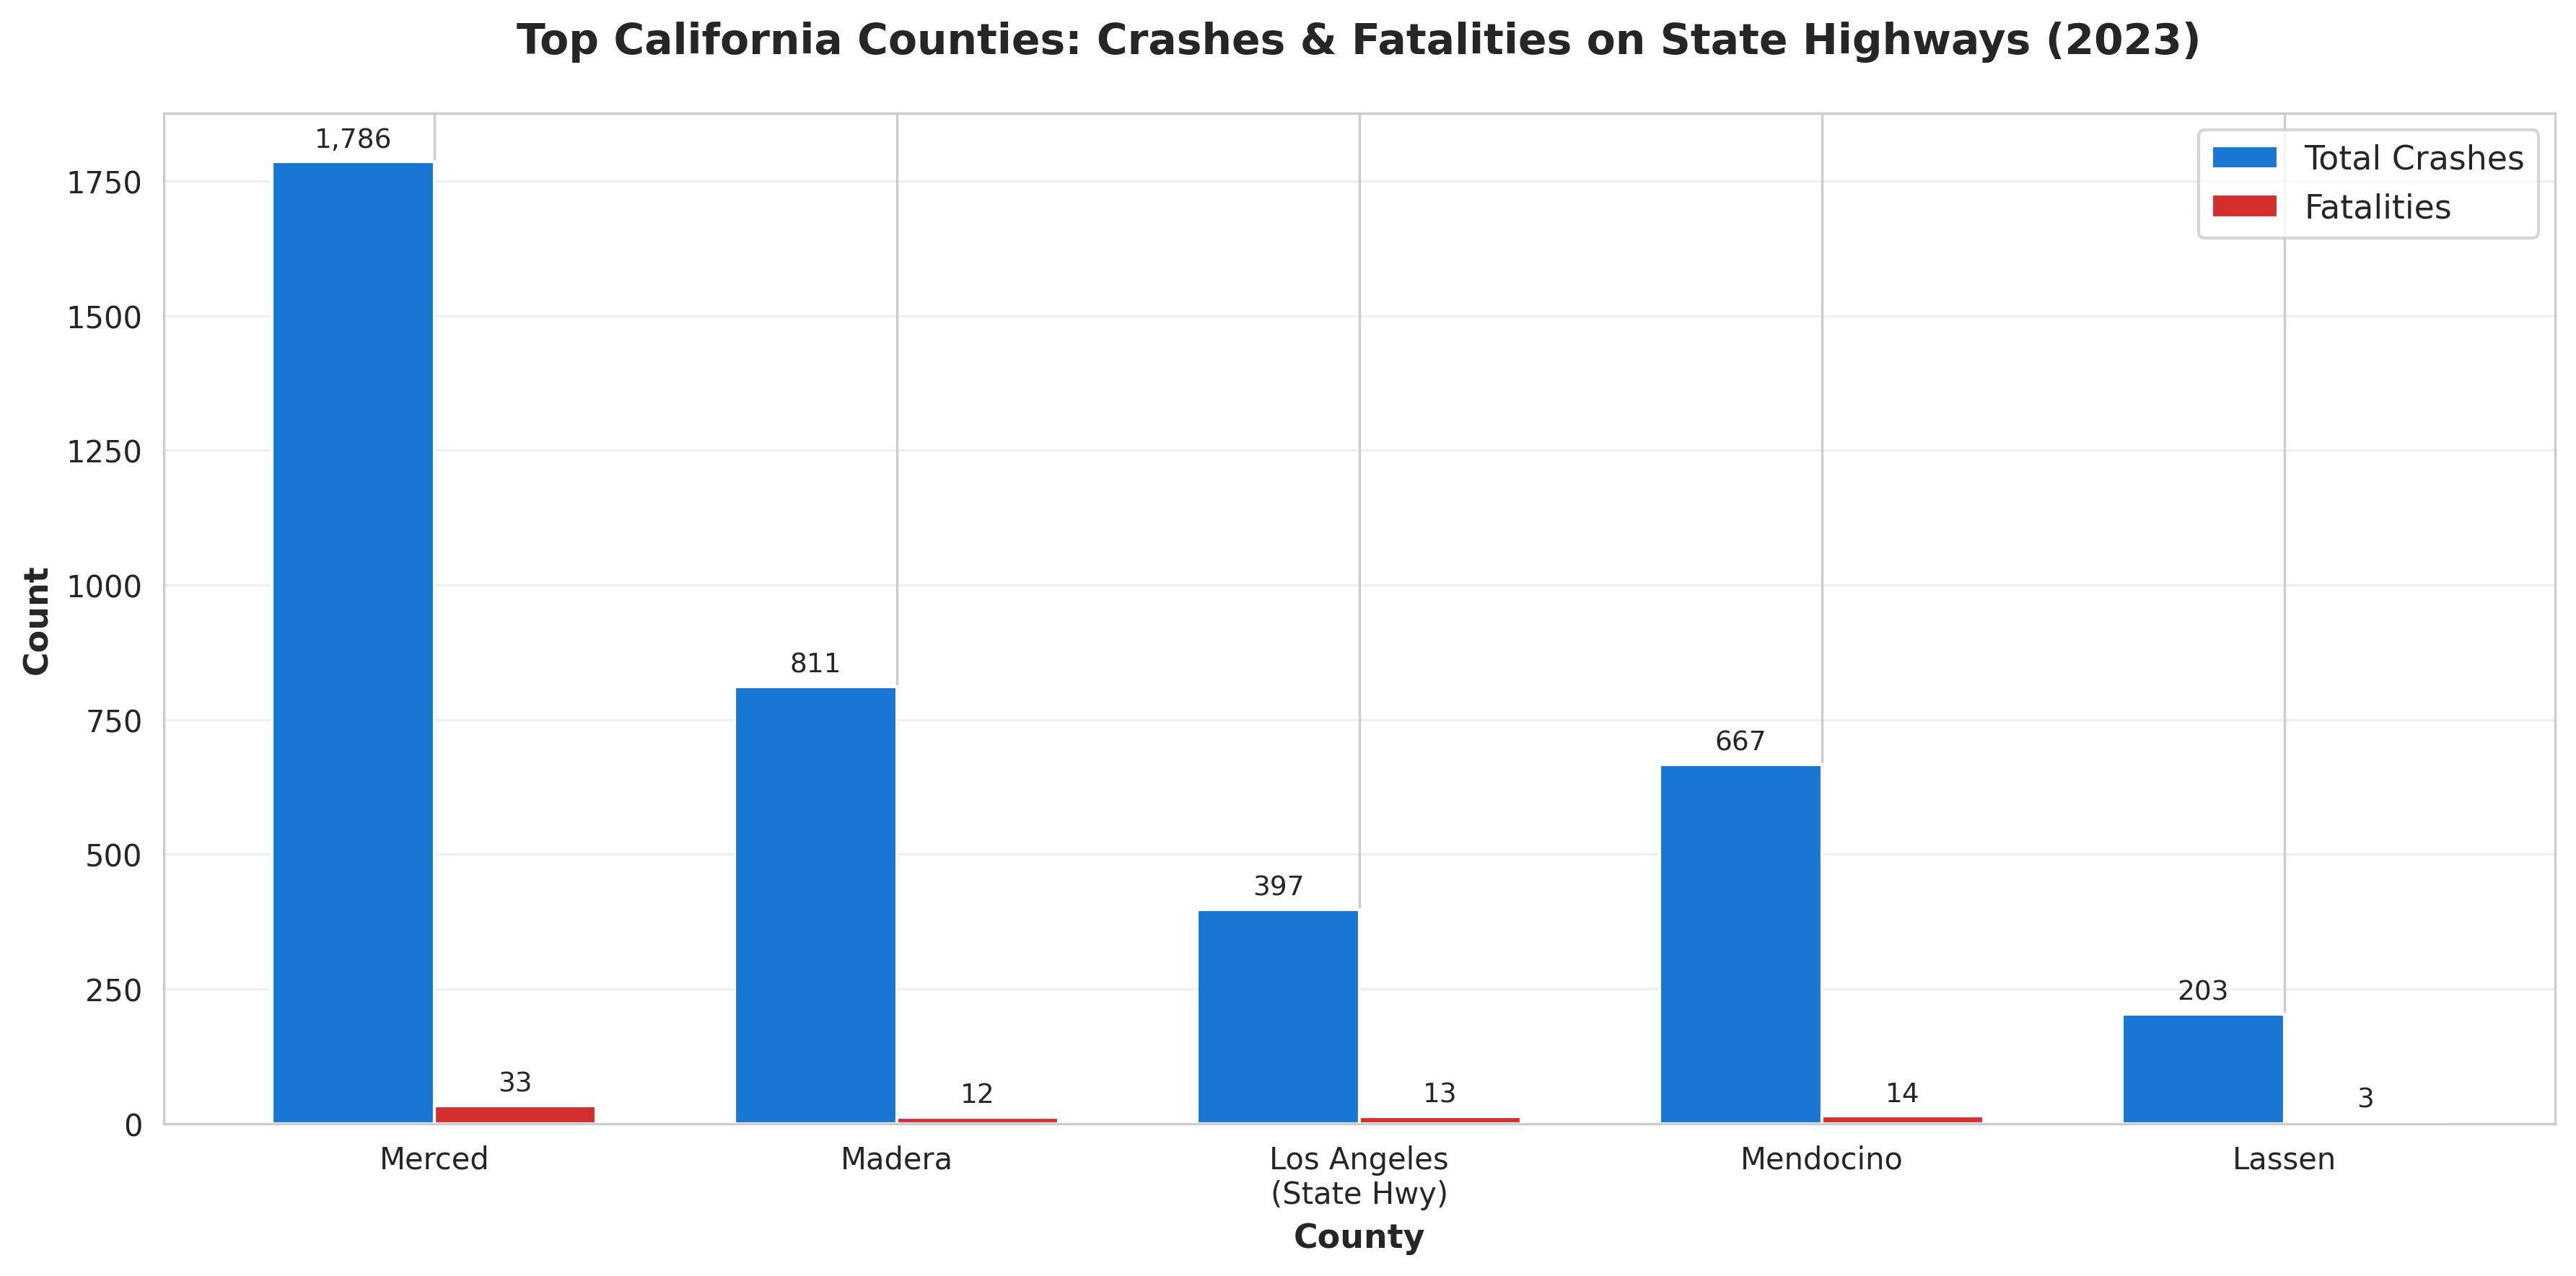
Analyzing car accident data at the county level reveals significant regional disparities in traffic safety. While comprehensive data for all roadways in 2024 and 2025 is still being compiled, the 2023 data for state highways from Caltrans offers valuable insights into high-risk areas. It is important to note that this data only reflects incidents on state-maintained highways and does not encompass all local and county roads.
|
County
|
Total Crashes (State Highways)
|
Fatalities (State Highways)
|
Injured (State Highways)
|
|
Merced
|
1,786
|
33
|
1,066
|
|
Madera
|
811
|
12
|
438
|
|
Mendocino
|
667
|
14
|
266
|
|
Los Angeles
|
397
|
13
|
253
|
|
Lassen
|
203
|
3
|
108
|
Source: Caltrans 2023 Crash Data on California State Highways
Los Angeles County, despite having a lower number of crashes on state highways in this specific dataset, consistently reports the highest overall number of traffic-related injuries and fatalities when all roadways are considered. For instance, in 2024, Los Angeles County recorded over 58,000 crashes involving death or injury, resulting in 653 fatalities .
Pedestrian & Bicycle Injury Trends
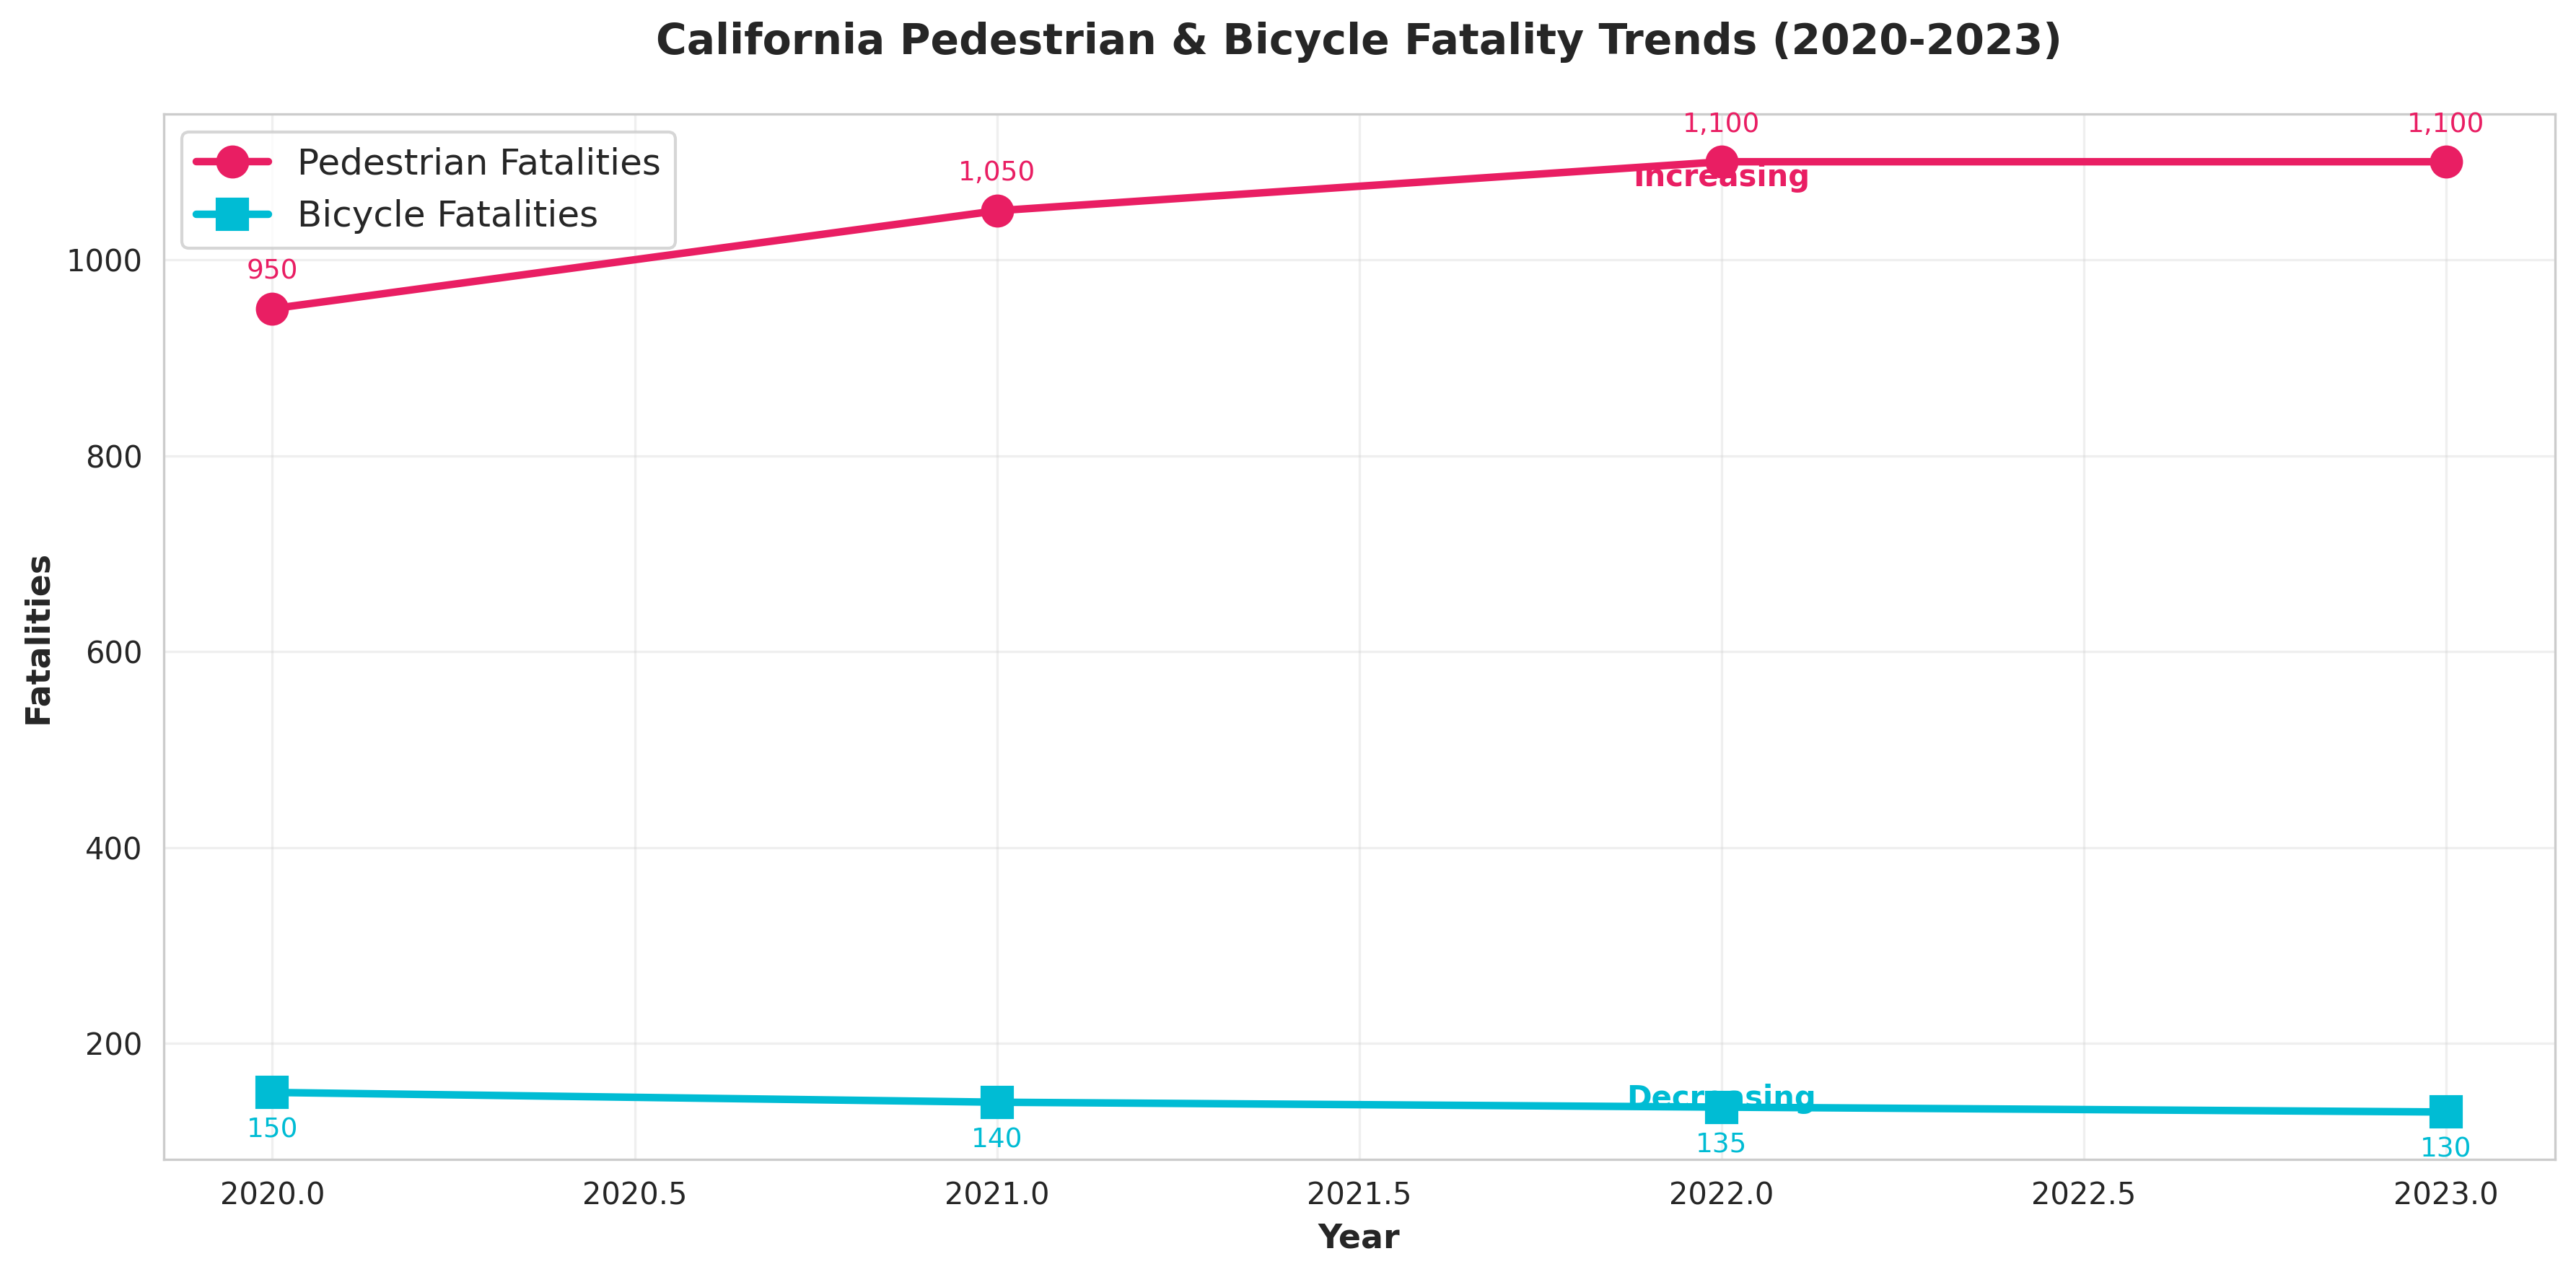
Pedestrian and bicycle safety remains a critical concern in California. Recent trends indicate a troubling increase in pedestrian fatalities, while bicycle fatalities have fortunately seen a slight decrease.
•Pedestrian Fatalities: Pedestrians account for approximately 25% of all motor vehicle crash fatalities in California, with over 1,100 deaths occurring annually . Data from 2020 to 2021 showed a notable increase in pedestrian deaths, a trend that has continued to be a major focus for traffic safety advocates.
•Bicycle Fatalities: In contrast, the number of bicyclist fatalities has shown a decreasing trend from 2020 to 2023. While still a significant issue, this positive development suggests that safety initiatives and infrastructure improvements may be having an impact.
DUI Accident Statistics
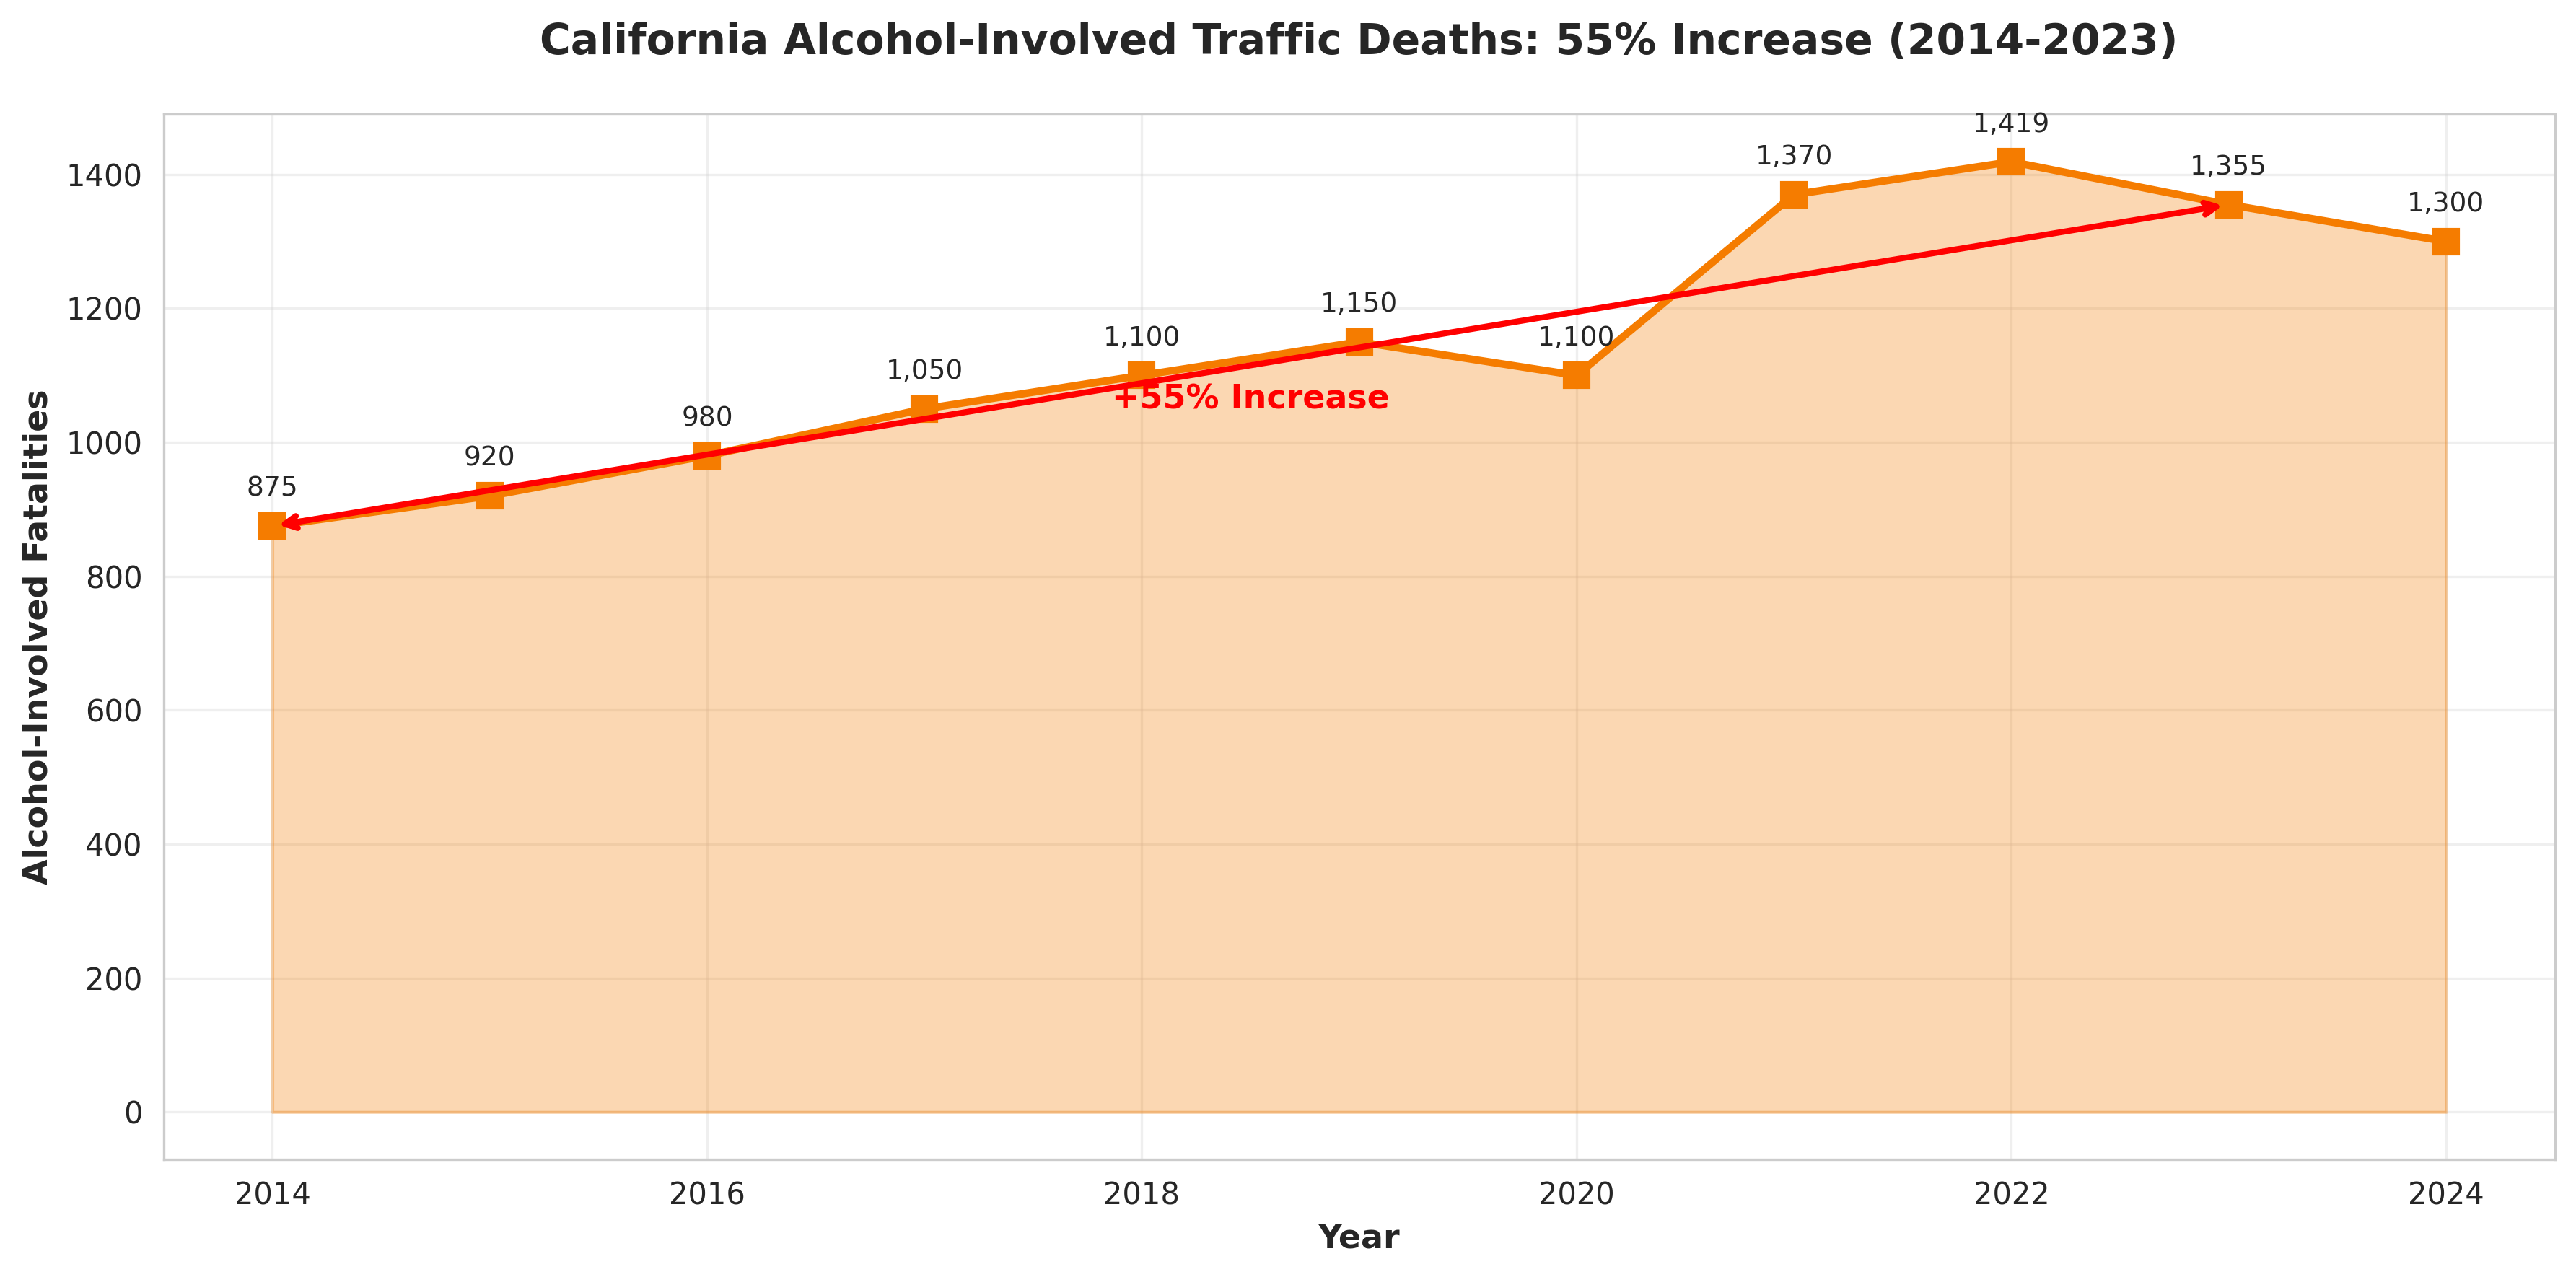
Driving Under the Influence (DUI) of alcohol and other substances continues to be a primary contributor to fatal and serious injury crashes in California. In 2023, there were 1,355 fatalities in alcohol-involved crashes, which, while a 4.5% decrease from 2022, represents a staggering 55% increase since 2014 . Alcohol-related crashes consistently account for approximately 30% of all traffic fatalities in the state.
Insurance Claim Payout Averages
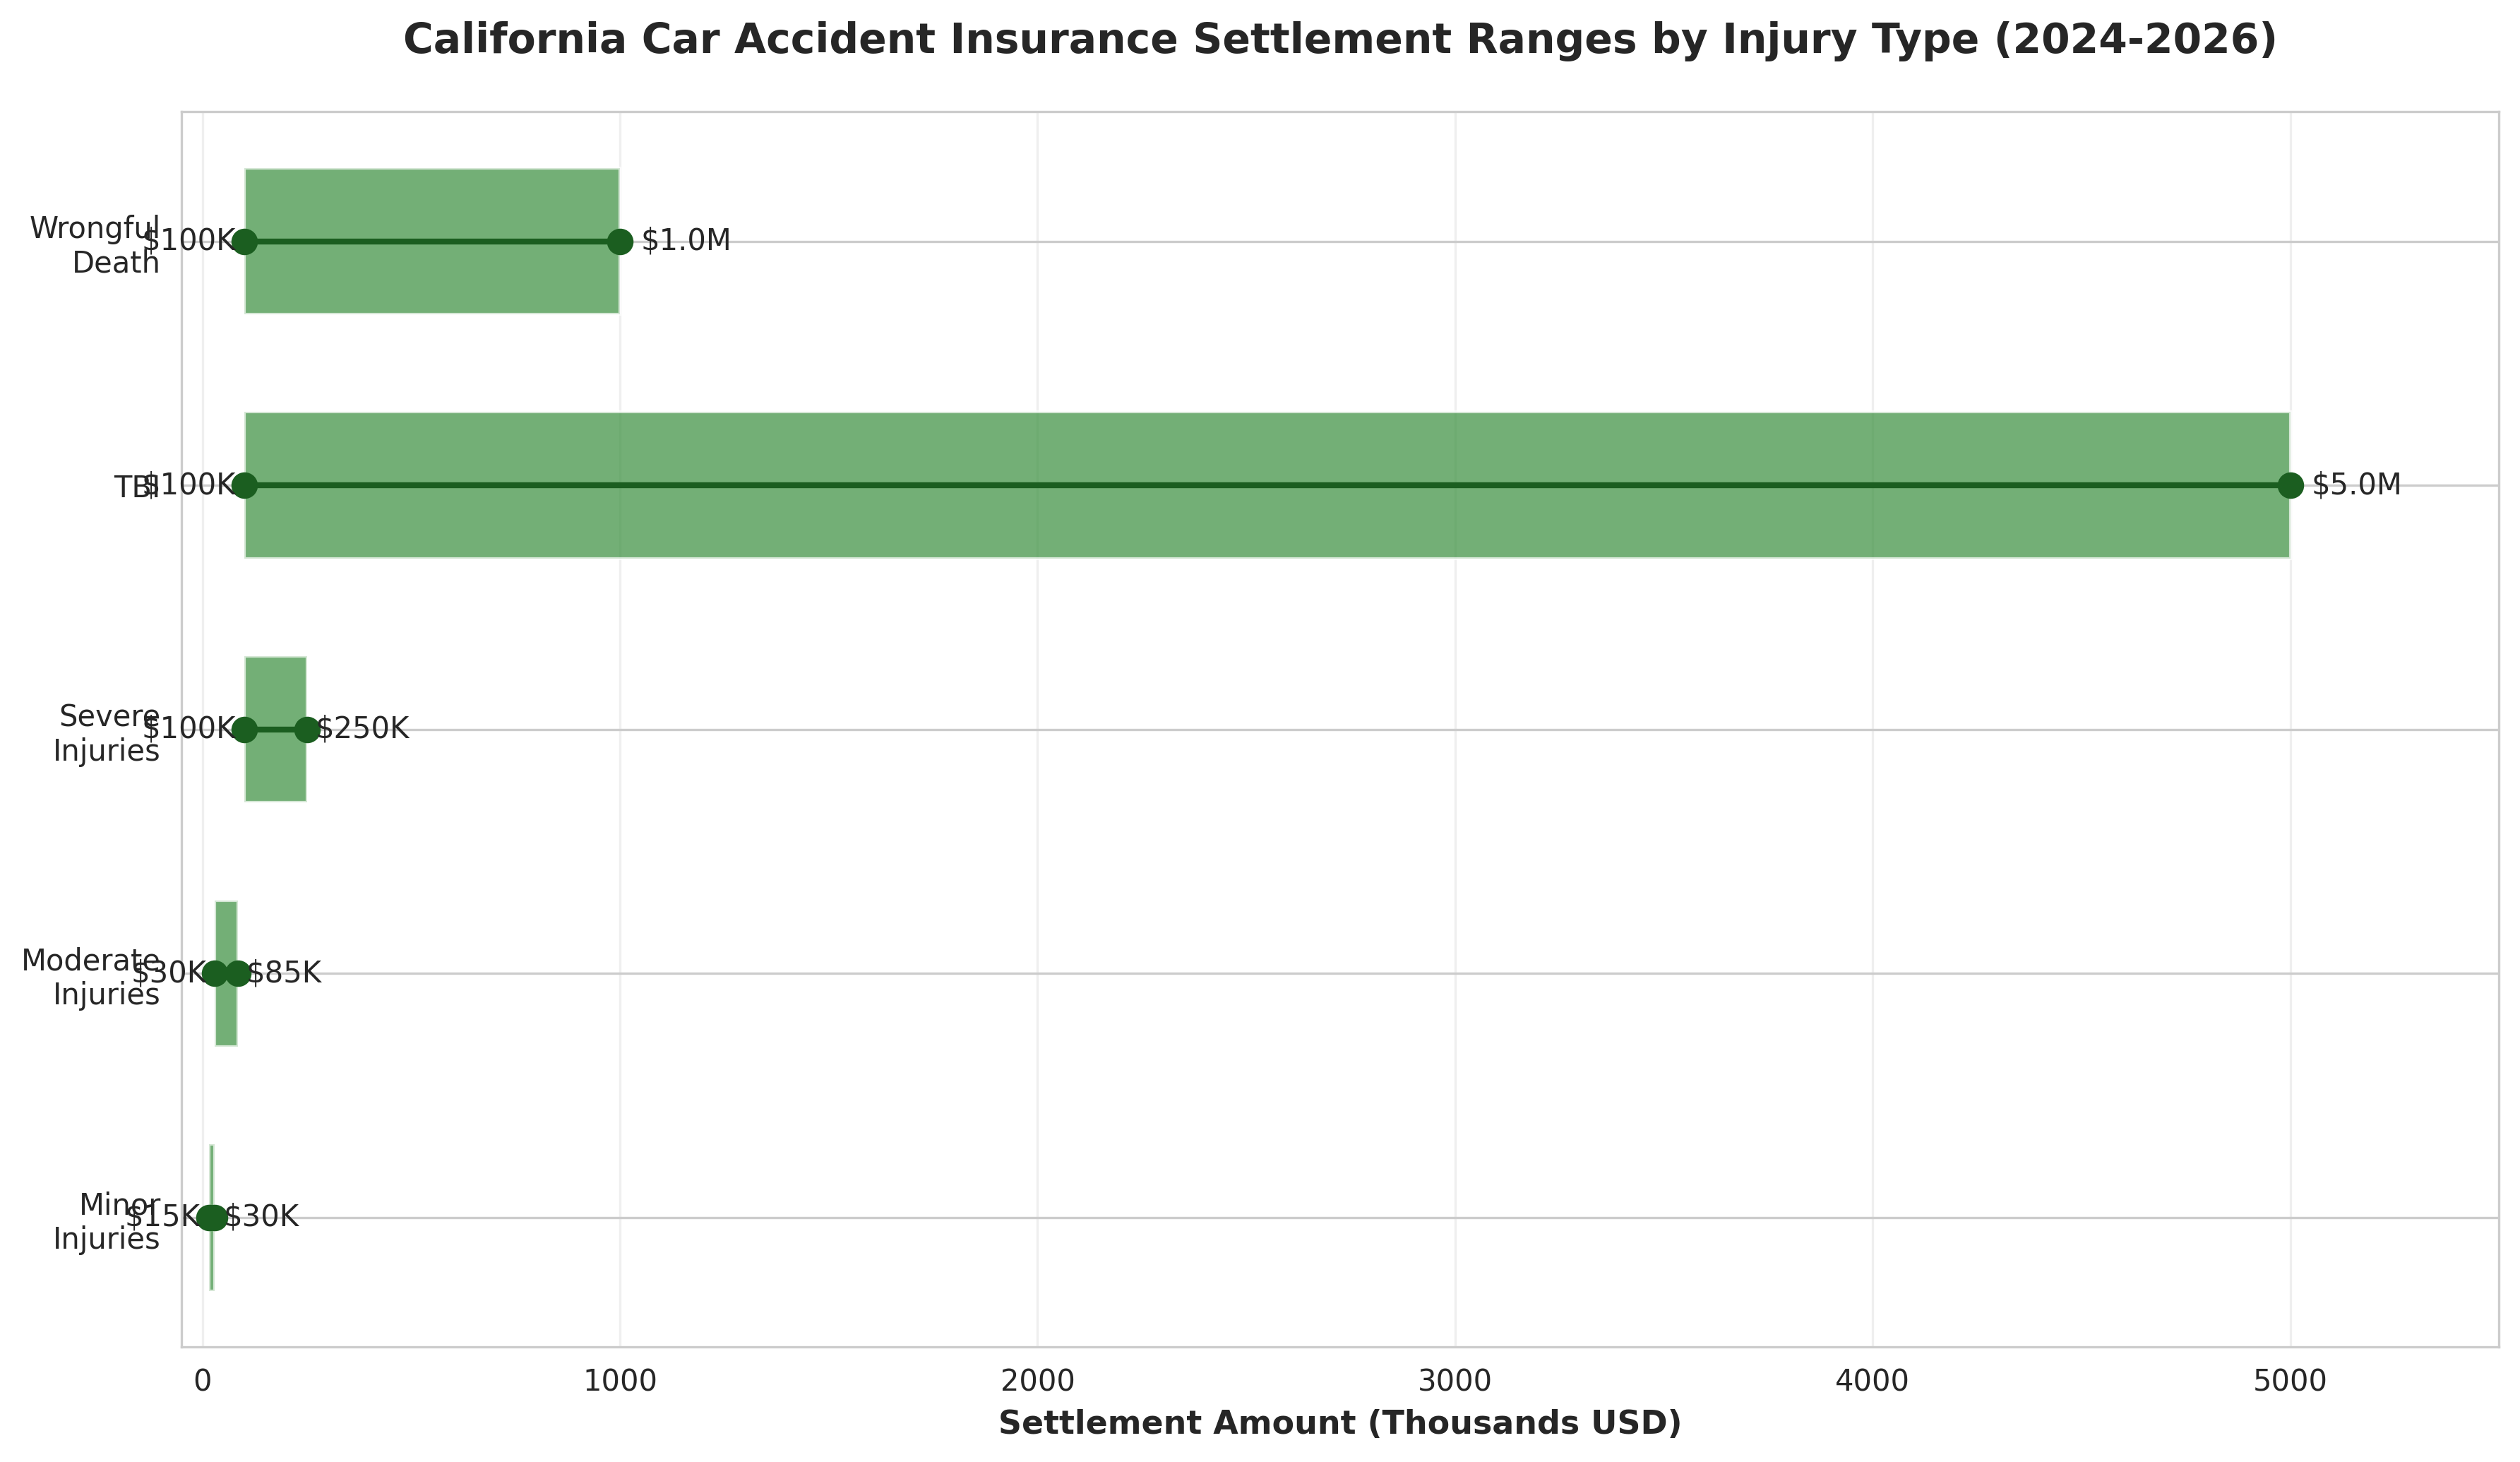
The financial consequences of car accidents are substantial, with insurance claim payouts varying widely depending on the severity of the injuries. Data from various California law firms and insurance reports from 2024-2026 provide the following average settlement ranges:
|
Injury Severity
|
Average Settlement Range
|
|
Minor Injuries (e.g., whiplash)
|
$15,000 – $30,000
|
|
Moderate Injuries (requiring surgery)
|
$30,000 – $85,000
|
|
Severe Injuries
|
$100,000 – $250,000+
|
|
Traumatic Brain Injury (TBI)
|
$100,000 – $5,000,000+
|
|
Wrongful Death
|
$100,000 – $1,000,000+
|
Source: Various legal and insurance industry data (2024-2026)
Wrongful Death Numbers
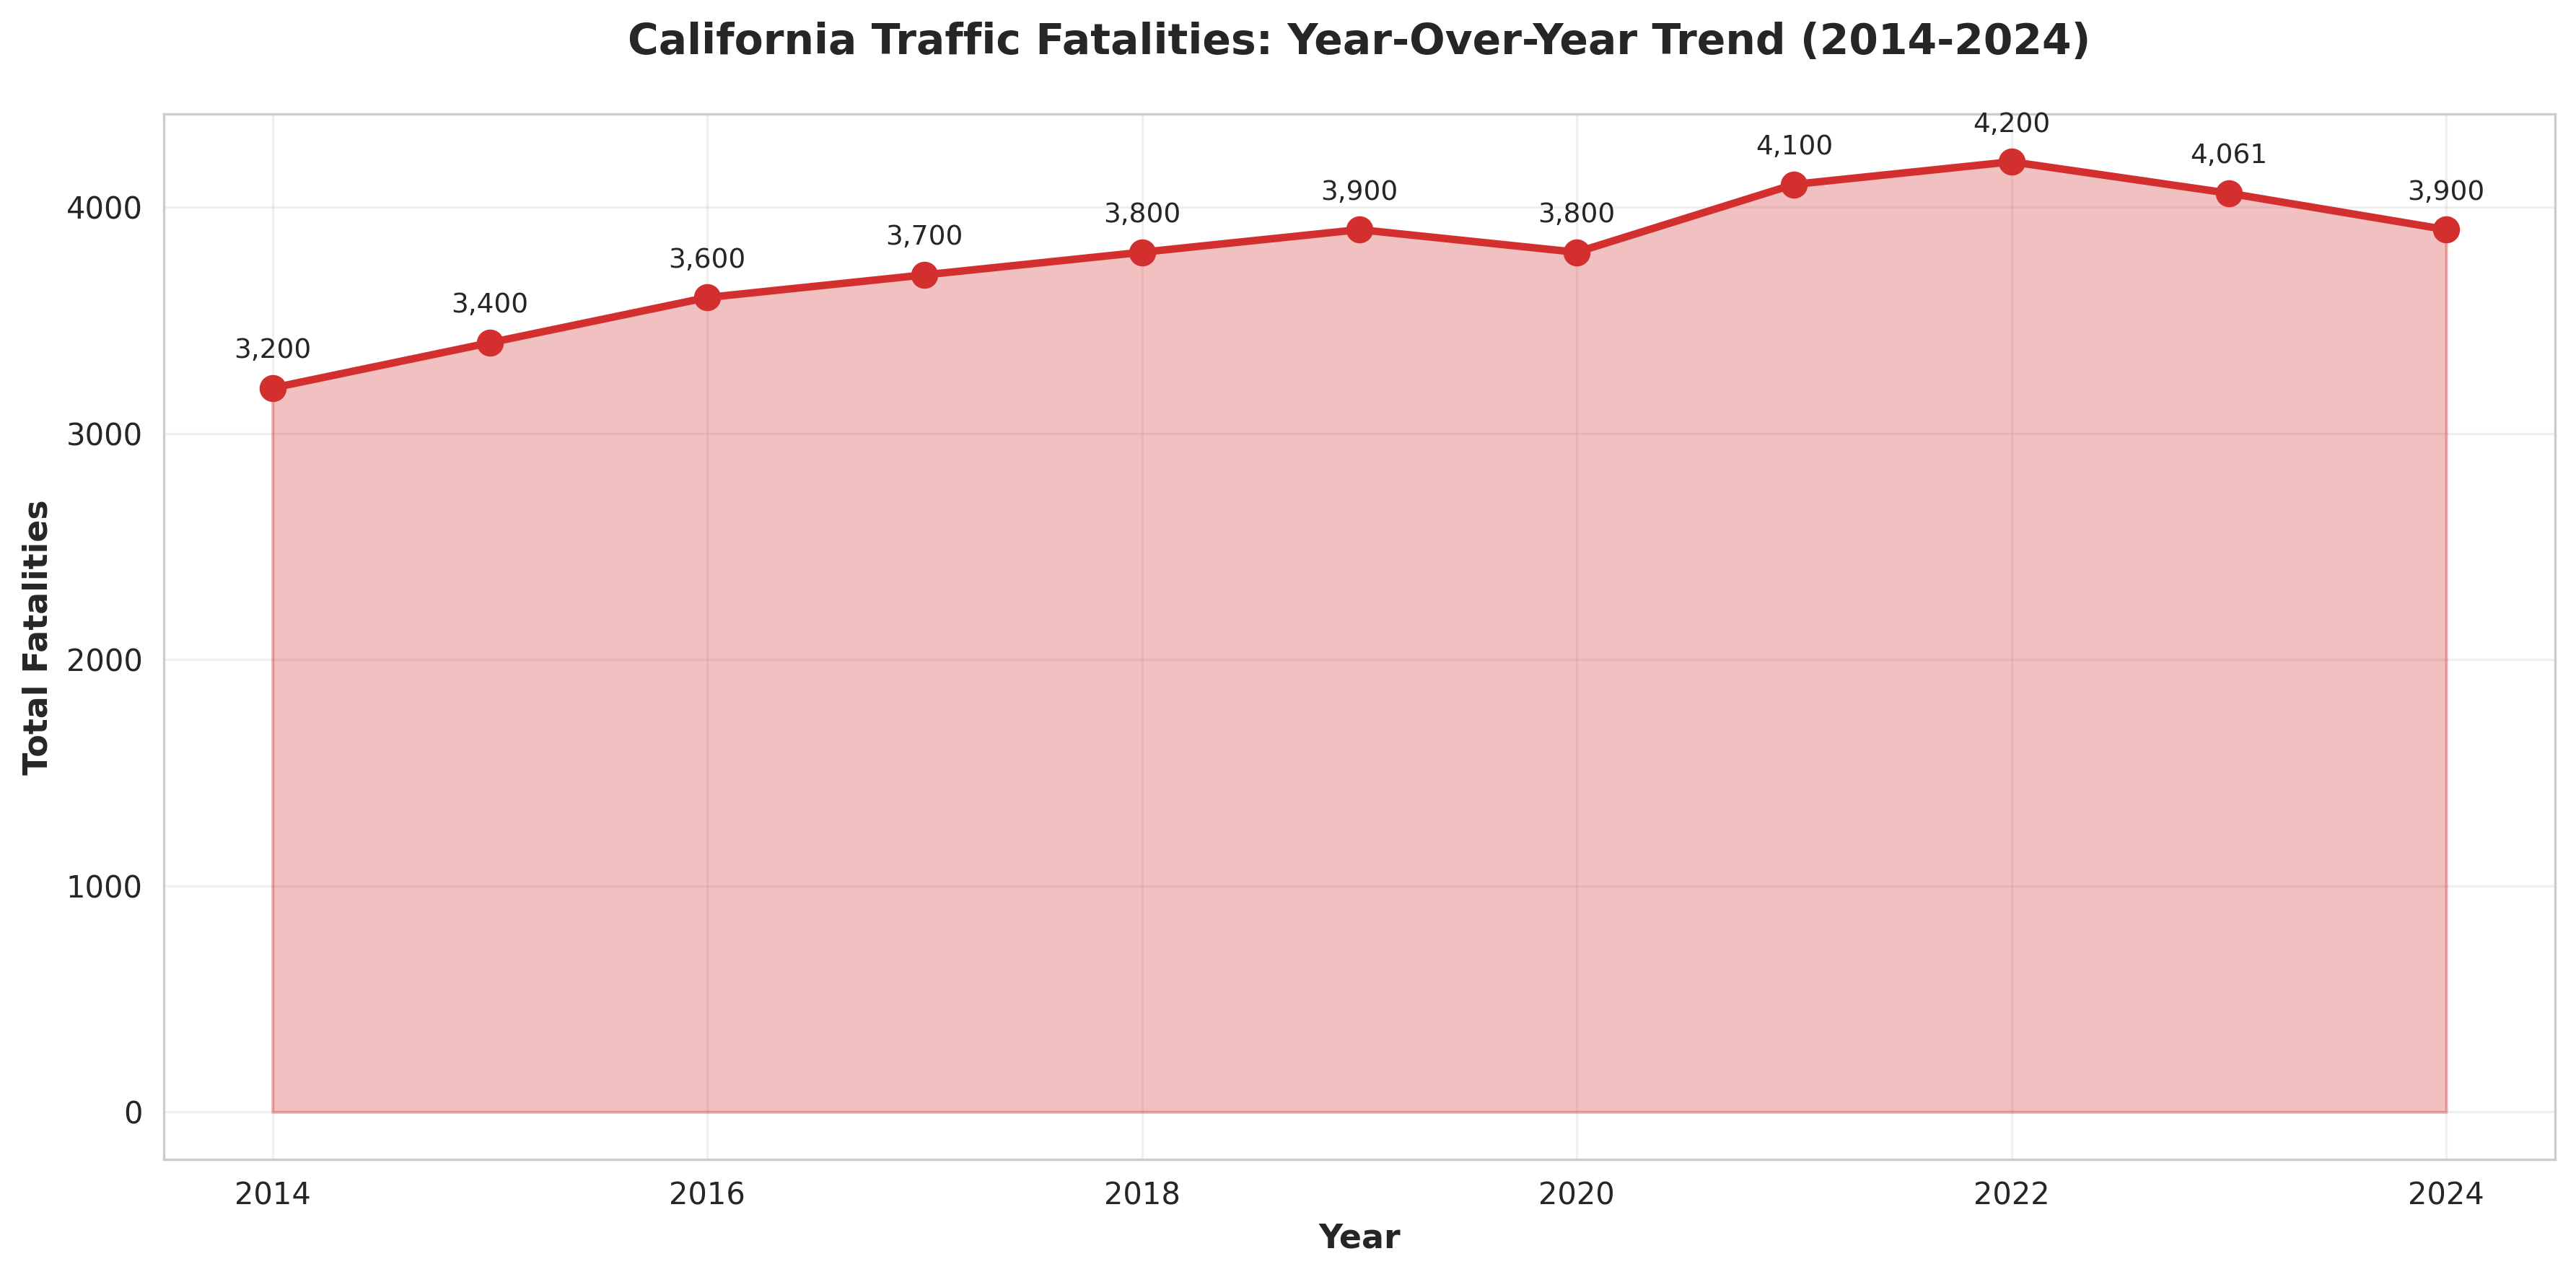
California continues to experience a high number of wrongful deaths resulting from traffic accidents. In 2023, there were 4,061 traffic-related fatalities across the state . Projections for 2024 indicated a slight decrease, with estimates around 3,800 to 4,000 deaths. Single-vehicle crashes are a primary contributor, accounting for 56% of all fatal accidents.
Hospitalization Costs by Injury Type
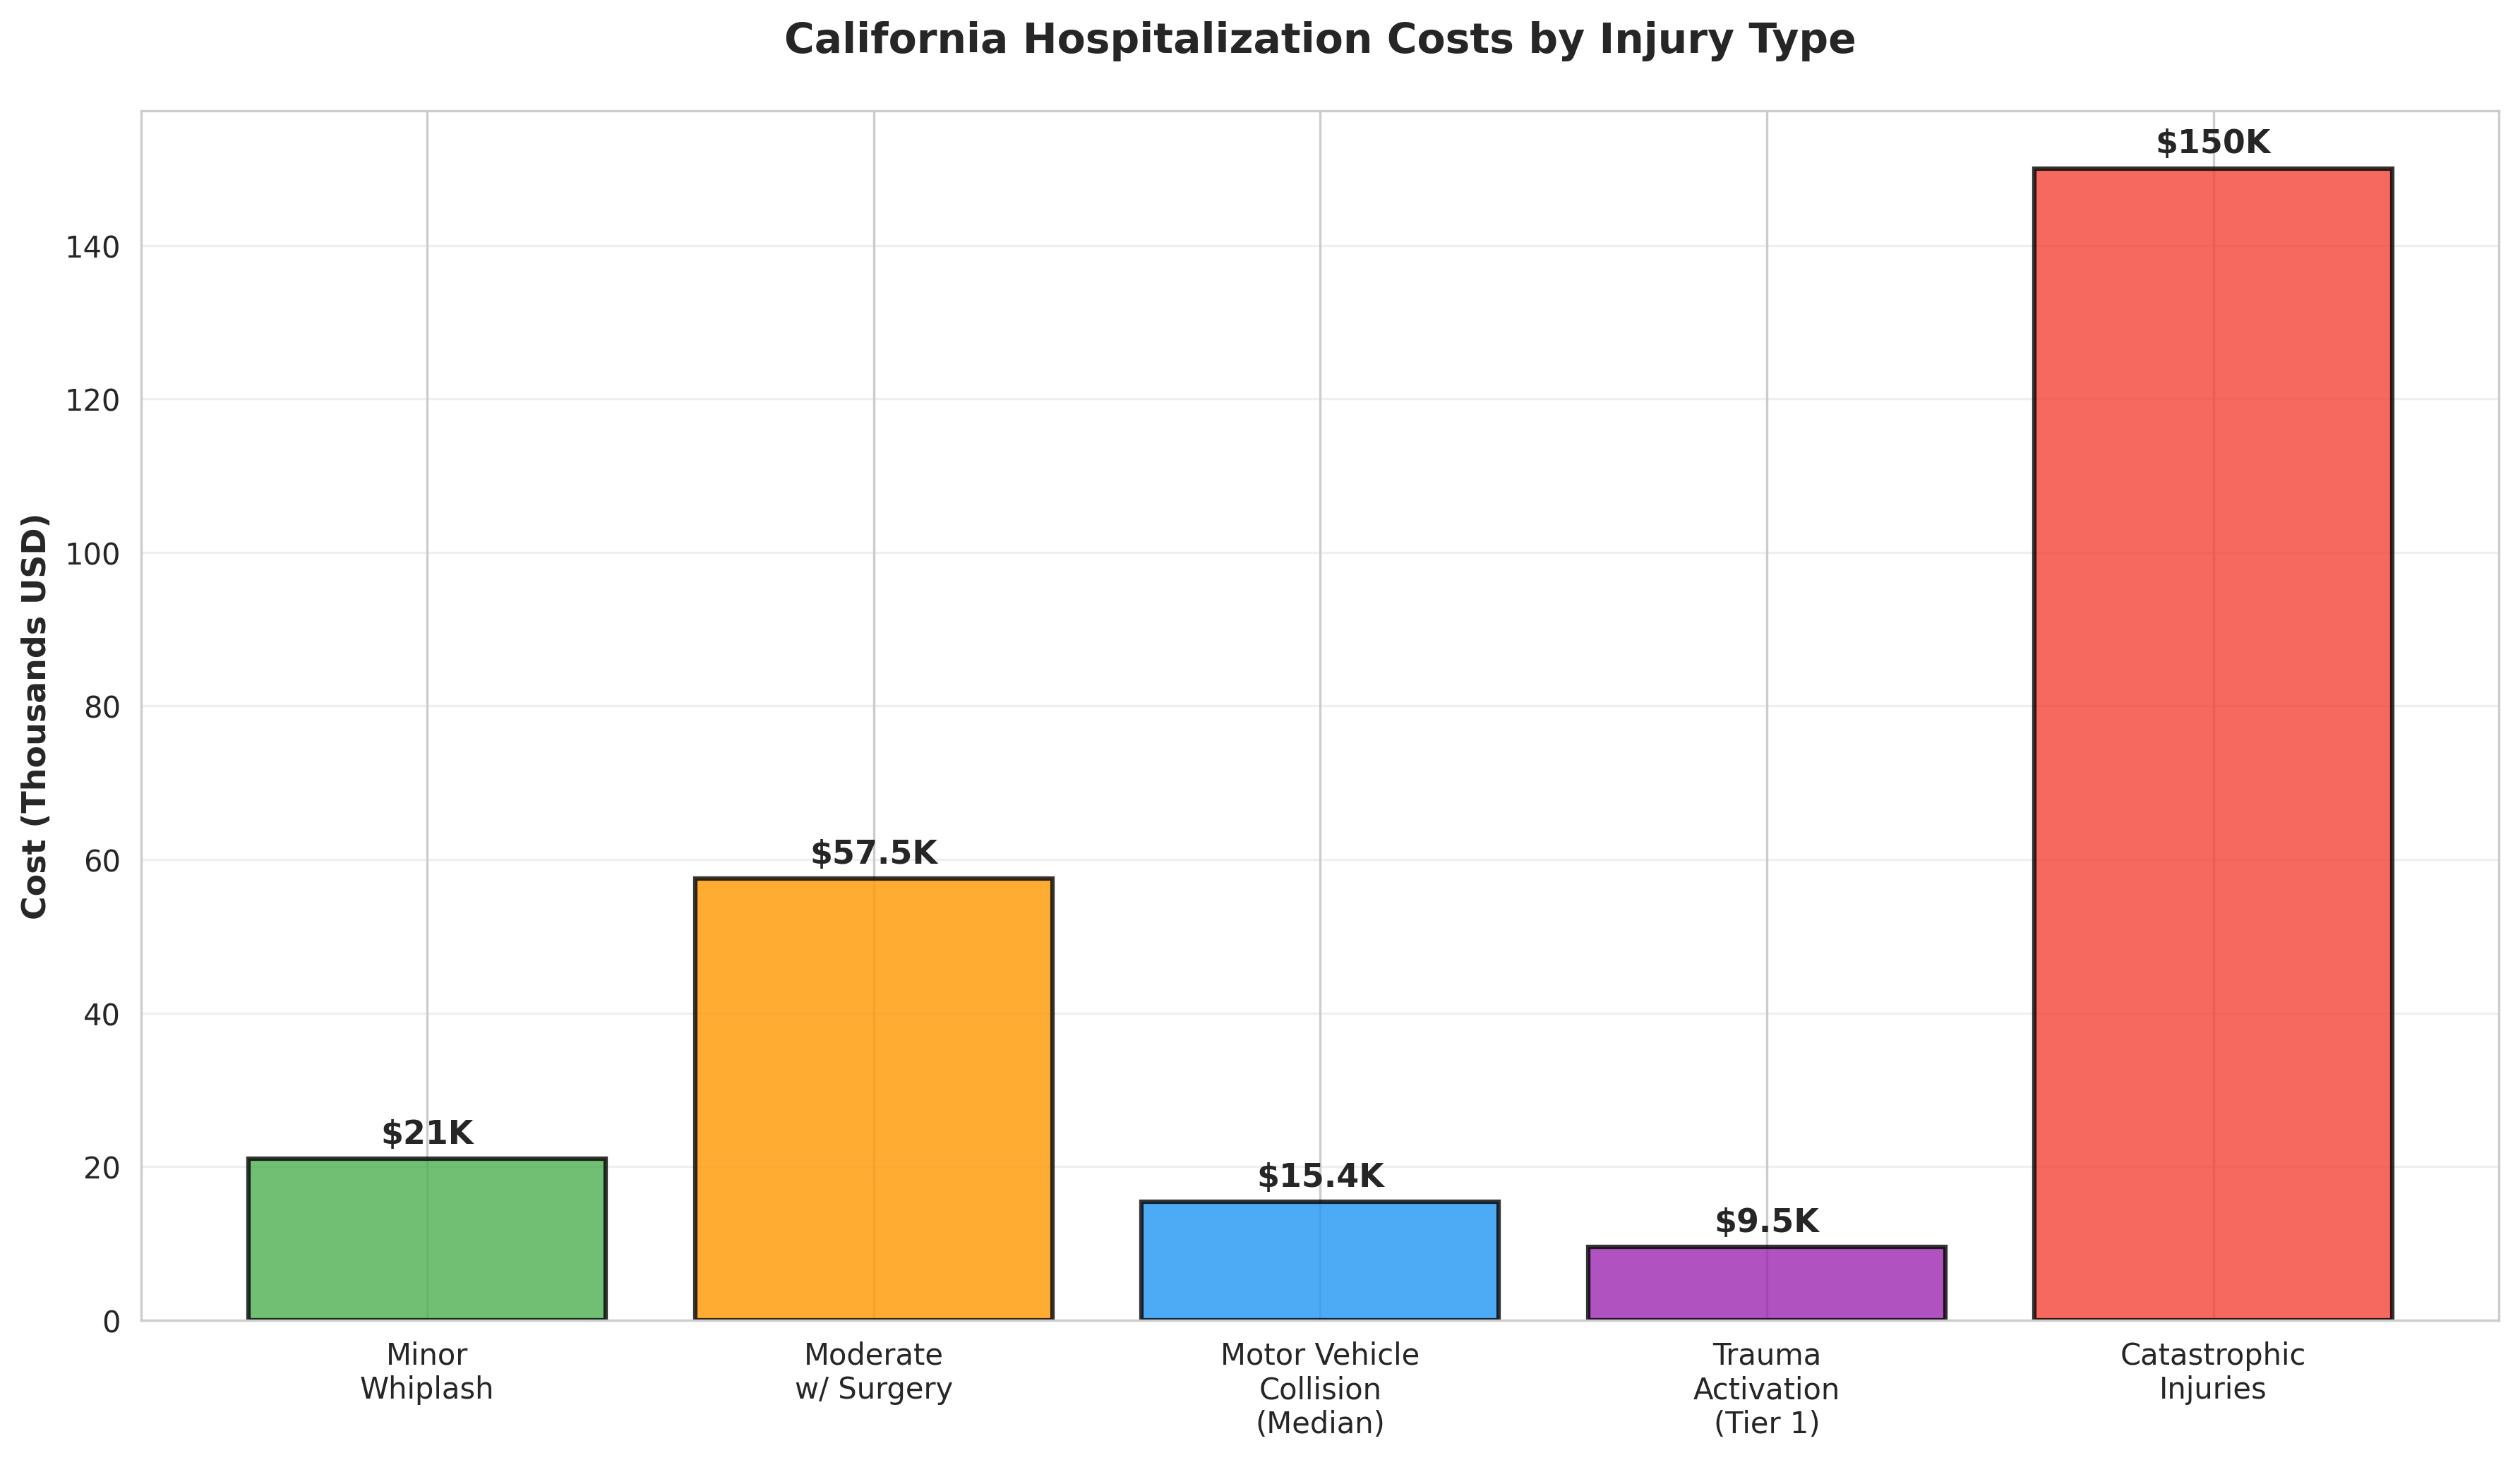
The medical costs associated with car accident injuries place a significant burden on individuals and the healthcare system. The costs vary dramatically based on the type and severity of the injury.
•Median Inpatient Costs: For motor vehicle collisions, the median inpatient cost between 2012 and 2021 was approximately $15,412 .
•Trauma Center Fees: A Tier 1 trauma activation fee alone can have a median cost of $9,500.
•Total Economic Impact: In 2018, the total economic cost of traffic crash deaths in California was estimated at $5.83 billion, with $49 million in direct medical costs and $5.49 billion in work loss costs .
Conclusion
The data presented in this report underscores the ongoing challenges in ensuring roadway safety for all Californians. While there have been some improvements, such as a decrease in bicycle fatalities, the overall trends in total fatalities, pedestrian deaths, and alcohol-involved crashes remain a serious concern. The high costs associated with these accidents, both in terms of human life and economic impact, highlight the critical need for continued investment in traffic safety initiatives, public awareness campaigns, and effective enforcement.